Results
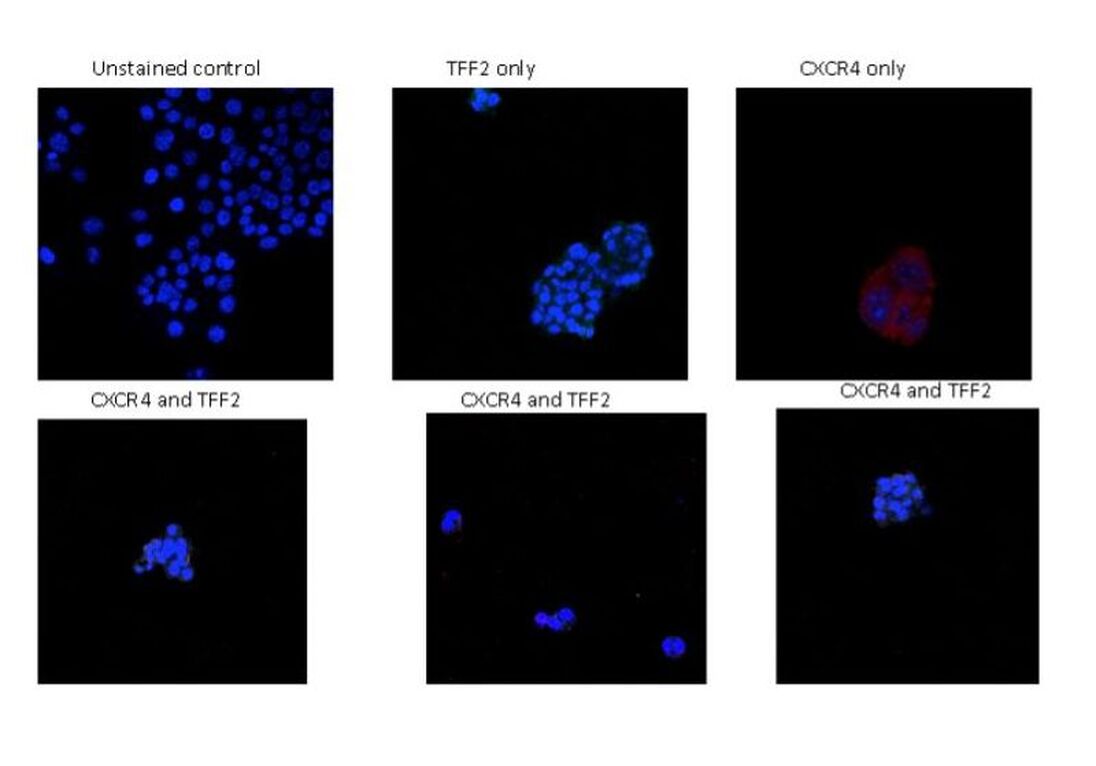
A variety of controls were taken first to ensure that the antibodies react only in the presence of certain signals or receptors. The figure to the right shows the emittance of specific colors when the cells are unstained or treated for CXCR4 and/or TFF2. The nucleus was visualized using DAPI, thus expressing the color blue. This helps in locating the cells as well as identifying the area in which the signals are sent and received. The controls show that there is minimal to no non-specific receptor binding. These controls also allowed for the affirmation that the signals and receptors would be excited and emit colors. This meant that there was some appearance made by CXCR4 and TFF2. Since there is a lack of red or green in the first “unstained” control we see that the DAPI only stained the nucleus. With the “TFF2 only” and “CXCR4 only” controls we see outlines of the specific color on the cell membrane. Overall, showing that each antibody emitted color only when attached to its corresponding antibody.
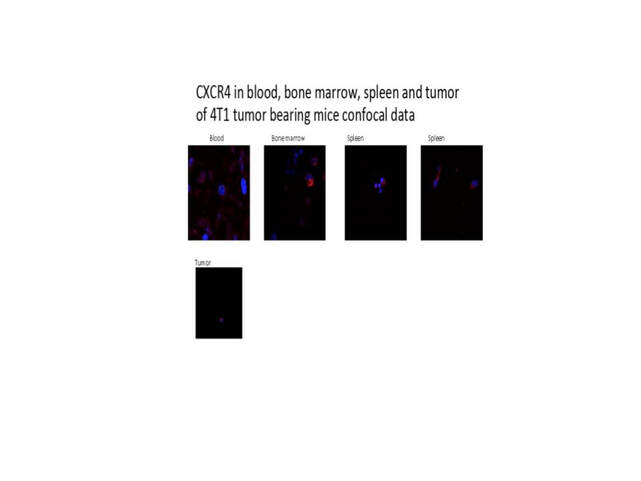
CXCR4 visualization
The figure above shows the amount of CXCR4 in the blood, bone marrow, spleen, and tumor of the 4T1 tumor-bearing mice. Due to the fact that the antibodies for the CXCR4 had been treated with Alexa 555 (red), we see a variety of layers of red around the cell membranes. These layers indicate that there is an abundant attendance of excited CXCR4 receptors. Which in turn displays the presence and location of CXCR4, that can be used as a basis for predicting where the TFF2 may be.
CXCR4 & TFF2 Visualization
In the figure to the left there are green, red, and yellow specs surrounding the cell membrane. The red signifying the CXCR4 receptors, the green signifying the TFF2, and the yellow meaning that there is either overlap or binding between CXCR4 and TFF2. The yellow being a positive sign since it shows CXCR4 and TFF2 in the same place indicating communication between the cancer cell and the MDSC.